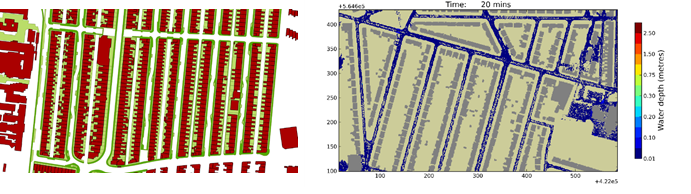
WP2a. Inundation Simulation
In designing a Blue-Green City it is necessary to understand how the probability of flooding is spatially distributed across the city and how it evolves through time as climate and land-uses change.
Aims
- develop the CityCAT hydrodynamic model to better represent urban areas
- fully couple the surface flow model with a storm sewer network model
- represent key Blue-Green infrastructure (e.g. blue-green roofs, permeable areas, swales, water butts) in the model
- carry out an ensemble of simulations addressing the uncertainty and variability in the characteristics of present and future extreme rain storms
CityCAT (City Catchment Analysis Tool) was developed at Newcastle University. Simulations can be viewed on YouTube.
WP2a team comprised Nigel Wright, Sangaralingam Ahilan and Andrew Sleigh (University of Leeds) and Chris Kilsby and Vassilis Glenis (Newcastle University).
Outputs
- A new storm sewer network model has been developed which can handle the flashy and pressurised flows found in sewers. For the first time, the link between the gullies/drains and the sewer pipes is included in the model which is fully coupled with the surface to model both inflows and outflows.
- New features have been added to represent key Blue-Green infrastructure such as permeable pavements and surfaces, green and blue roofs, swales and water butts to allow for application in an innovative and flood resilient city environment.
Key Findings
- CityCAT successfully reproduces observed depths of flooding, and flows in the sewer network, associated with storm events such as the Toon Monsoon of 2012
- The effect of Blue-Green features on flows and flood depths can be assessed across the whole city
- A swale on St James Boulevard has far-reaching benefits across the urban core
- Lesser, but worthwhile, benefits can be incrementally achieved by widespread implementation of features, particularly in areas upstream of at risk locations
Sediment dynamics and flood risk in fluvial systems
WP2a also investigated the impact of SuDS and Blue-Green infrastructure on water flow, sediment dynamics and flood risk in fluvial systems. Research was conducted in Johnson Creek, Portland Oregon US.
This study investigated sedimentation dynamics on a recently restored floodplain in the East Lents area of the Johnson Creek catchment.
This study used a 2D hydro-morphodynamic model for the prediction of flow and suspended sediment dynamics in downstream Johnson Creek, the East Lents reach, where the bank of the river has been reconfigured to reconnect to a restored floodplain on a 0.28 km2 (28-ha) site.
The simulation scenarios included event-based (10, 50, 100, and 500 year floods) deposition modelling of flood events and long-term modelling using 64 historical flood events between 1941 and 2014.
Simulation results showed that the restored floodplain attenuates the upstream flood peak by up to 25%.
Results also indicated that 20-30% of sediment transported from further upstream is deposited on the East Lents floodplain.
See Ahilan et al., 2016 for a full report.